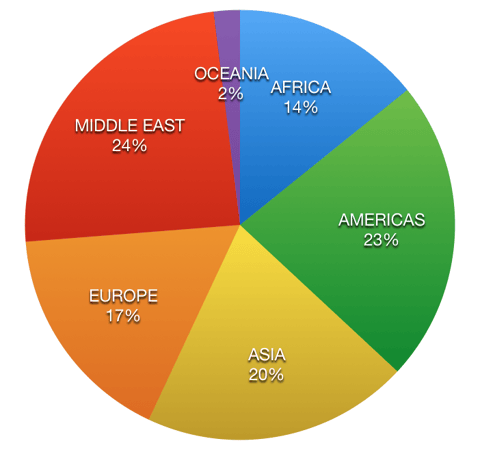
What the data for the 3rd quarter (July 1st to September 30) looks like.
With the latest data for international car shipping now available, we can take a look at which overseas destinations imported the most US cars in containers.
 1. Middle East
31,749 cars (-13% YoY)
Despite importing 13% less cars in the 3rd quarter (compared to last year), the Middle East remained as the most popular destination in the world. This was mainly due to large gains in Iraq (+40%) and Saudi Arabia (+9%).
2. Americas
29,732 cars (+26% YoY)
Central and South America have experienced the second largest gains of the quarter. The largest growth came from Belize (+73%), Chile (+26%), and Honduras (+22%).
3. Asia
26,233 cars (-6% YoY)
Asia continues to be affected by changing car import laws and growing economies in the region. Japan (+58%), Guam (+51%), India (+40%), and South Korea (+38%) are the top growing destinations in Asia. While China (-12%) is experiencing a downward trend due to a slowing economy.
4. Europe
21,948 cars (-27% YoY)
The strong US dollar continued to limit US car imports into the region. Germany (-7%) was also hit by an expiring US military contract which signaled a decline in the number of privately owned vehicles (POV) being imported. Russia (+109%) was the top growing destination in Europe due to new BMW imports from the US.
5. Africa
18,563 cars (+52% YoY)
Africa saw the strongest growth in the number US car imports during the 3rd quarter. With strengthening economies and favorable import laws allowed Cameroon (+54%), Senegal (+37%), Ghana (+14%), Benin (+13%), and Nigeria (+12%) to grow.
6. Oceania
2,579 cars (+4% YoY)
The smallest US car importer by volume (sorry Antartica), saw growth due to the increasing popularity of US classic cars and modern muscle cars like the new Ford Mustang. Australia (+39%), and New Zealand (+16%).